
Transform your business with an AI-powered data analyst
Transform your business with an AI-powered data analyst
Transform your business with
AI-powered data analyst
An expert in your data stack, AI works as an extension to your company's data analysts. You can get in touch via chat, email, or by submitting a ticket.
An expert in your data stack, AI works as an extension to your company's data analysts. You can get in touch via chat, email, or by submitting a ticket.
An expert in your data stack, AI works as an extension to your company's data analysts. You can get in touch via chat, email, or by submitting a ticket.
How it works?
01
Connect your database and activate tables to enable Patterns to understand your business context
02
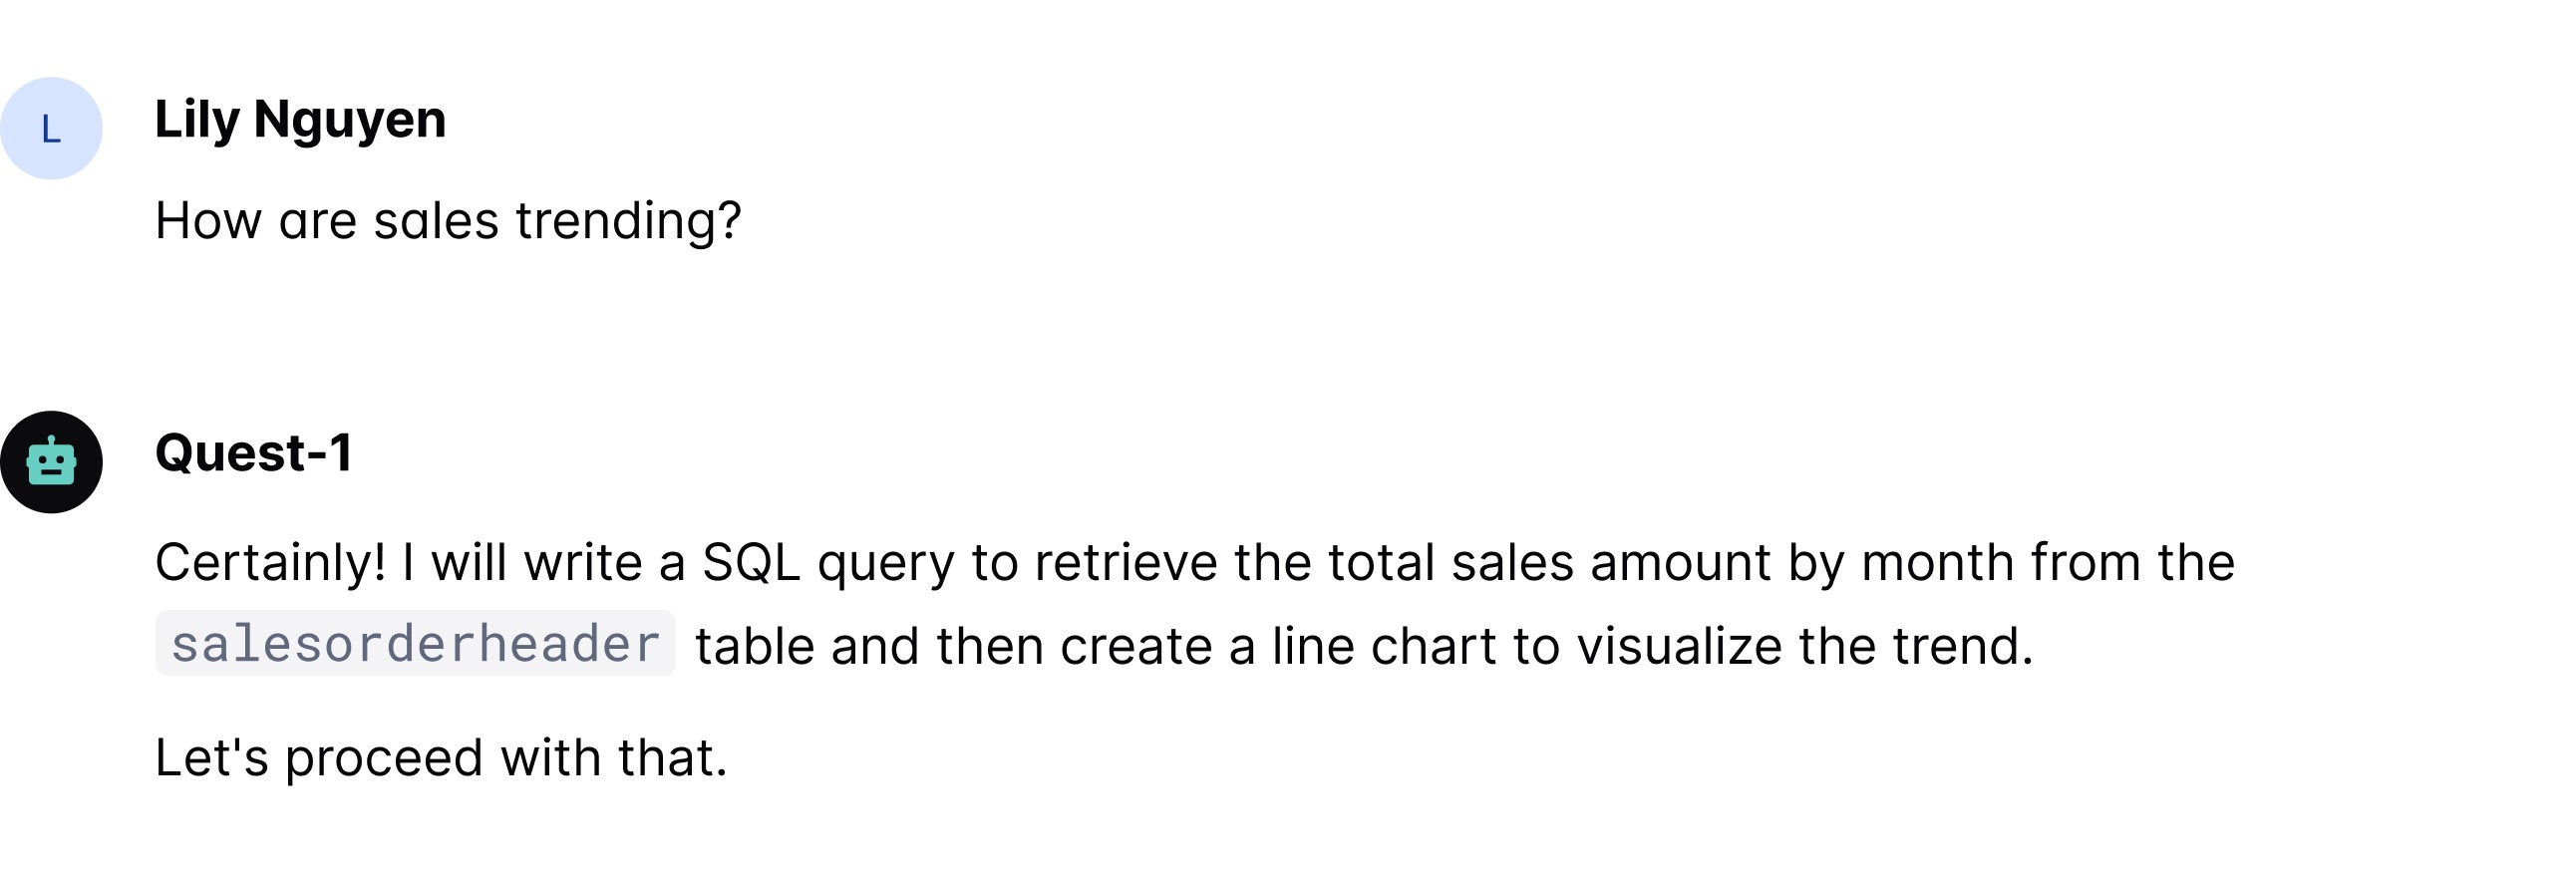
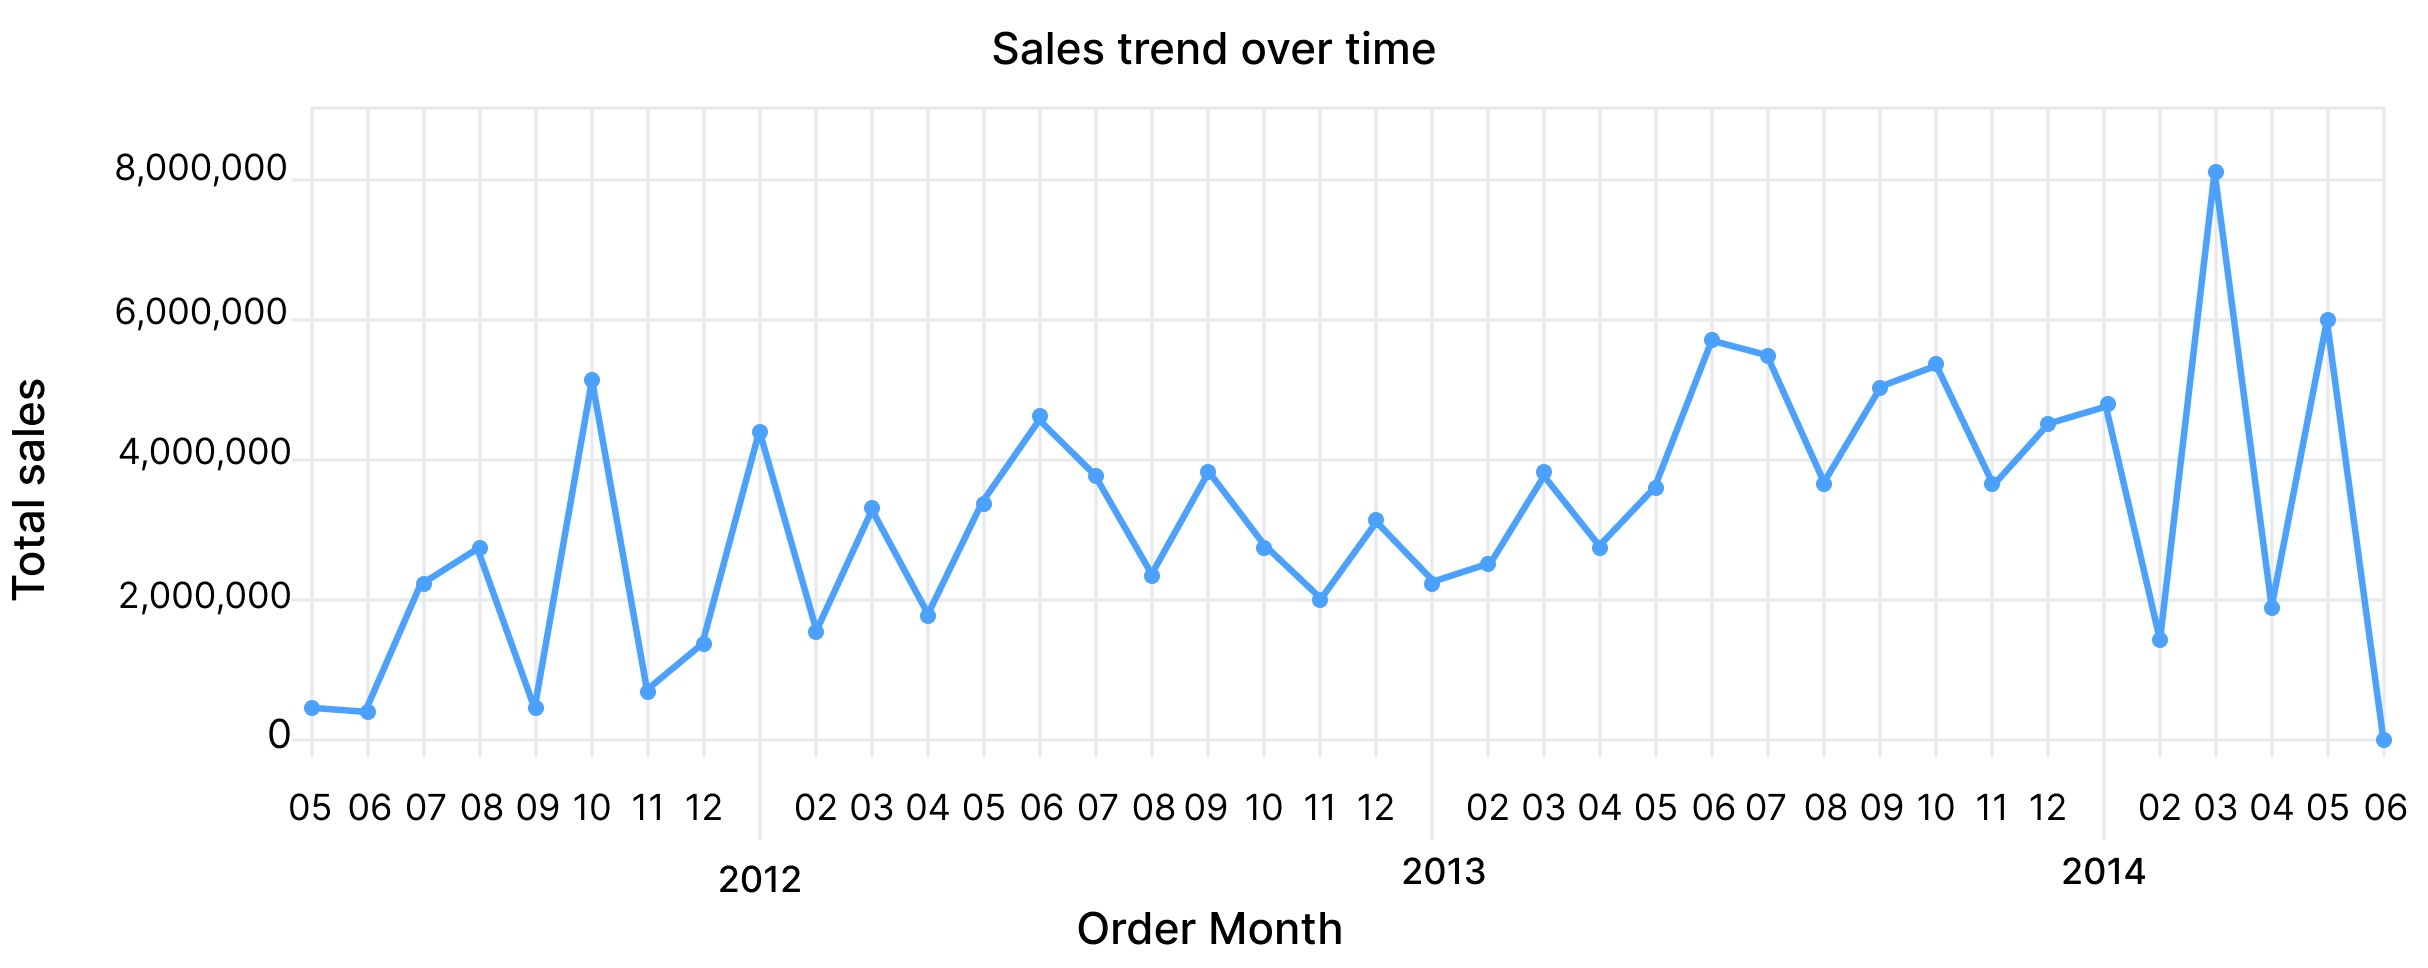
Simply make a request, and Patterns will search its knowledge base to generate a response: SQL, charting code or plain text
Query
Data
Chart
#
1
2
3
4
5
6
7
8
9
10
11
12
13
14
15
16
17
18
19
20
21
22
23
24
25
26
27
28
29
30
31
32
33
34
35
36
37
38
order_month
2011-05-01 00:00:00
2011-06-01 00:00:00
2011-07-01 00:00:00
2011-08-01 00:00:00
2011-09-01 00:00:00
2011-10-01 00:00:00
2011-11-01 00:00:00
2011-12-01 00:00:00
2012-01-01 00:00:00
2012-02-01 00:00:00
2012-03-01 00:00:00
2012-04-01 00:00:00
2012-05-01 00:00:00
2012-06-01 00:00:00
2012-07-01 00:00:00
2012-08-01 00:00:00
2012-09-01 00:00:00
2012-10-01 00:00:00
2012-11-01 00:00:00
2012-12-01 00:00:00
2013-01-01 00:00:00
2013-02-01 00:00:00
2013-03-01 00:00:00
2013-04-01 00:00:00
2013-05-01 00:00:00
2013-06-01 00:00:00
2013-07-01 00:00:00
2013-08-01 00:00:00
2013-09-01 00:00:00
2013-10-01 00:00:00
2013-11-01 00:00:00
2013-12-01 00:00:00
2014-01-01 00:00:00
2014-02-01 00:00:00
2014-03-01 00:00:00
2014-04-01 00:00:00
2014-05-01 00:00:00
2014-06-01 00:00:00
total_sales
567020.9498
507096.4690
2292182.8828
2800576.1723
554791.6082
5156269.5291
815313.0152
1462448.8986
4458337.4444
1649051.9001
3336347.4716
1871923.5039
3452924.4537
4610647.2153
3840231.4590
2442451.1831
3881724.1860
2858060.1970
2097153.1292
3176848.1687
2340061.5521
2600218.8667
3831605.9389
2840711.1734
3658084.9461
5726265.2635
5521840.8445
3733973.0032
5083505.3374
5374375.9418
3694667.9998
4560577.0958
4798027.8709
1478213.2920
8097036.3137
1985886.1496
6006183.2110
54151.4785
SELECT
DATE_TRUNC('month', orderdate) AS order_month,
SUM(totaldue) AS total_sales
FROM
sales.salesorderheader
GROUP BY
order_month
ORDER BY
order_month
03
Save and share analyses effortlessly, complete with contextual summaries and insights
04
Stay ahead with future developments, including more interfaces, deep-dive analysis, and proactive engagement
How it works?
01
Connect your database and activate tables to enable Patterns to understand your business context
02
Simply make a request, and Patterns will search its knowledge base to generate a response: SQL, charting code or plain text
Query
Data
Chart
#
1
2
3
4
5
6
7
8
9
10
11
12
13
14
15
16
17
18
19
20
21
22
23
24
25
26
27
28
29
30
31
32
33
34
35
36
37
38
order_month
2011-05-01 00:00:00
2011-06-01 00:00:00
2011-07-01 00:00:00
2011-08-01 00:00:00
2011-09-01 00:00:00
2011-10-01 00:00:00
2011-11-01 00:00:00
2011-12-01 00:00:00
2012-01-01 00:00:00
2012-02-01 00:00:00
2012-03-01 00:00:00
2012-04-01 00:00:00
2012-05-01 00:00:00
2012-06-01 00:00:00
2012-07-01 00:00:00
2012-08-01 00:00:00
2012-09-01 00:00:00
2012-10-01 00:00:00
2012-11-01 00:00:00
2012-12-01 00:00:00
2013-01-01 00:00:00
2013-02-01 00:00:00
2013-03-01 00:00:00
2013-04-01 00:00:00
2013-05-01 00:00:00
2013-06-01 00:00:00
2013-07-01 00:00:00
2013-08-01 00:00:00
2013-09-01 00:00:00
2013-10-01 00:00:00
2013-11-01 00:00:00
2013-12-01 00:00:00
2014-01-01 00:00:00
2014-02-01 00:00:00
2014-03-01 00:00:00
2014-04-01 00:00:00
2014-05-01 00:00:00
2014-06-01 00:00:00
total_sales
567020.9498
507096.4690
2292182.8828
2800576.1723
554791.6082
5156269.5291
815313.0152
1462448.8986
4458337.4444
1649051.9001
3336347.4716
1871923.5039
3452924.4537
4610647.2153
3840231.4590
2442451.1831
3881724.1860
2858060.1970
2097153.1292
3176848.1687
2340061.5521
2600218.8667
3831605.9389
2840711.1734
3658084.9461
5726265.2635
5521840.8445
3733973.0032
5083505.3374
5374375.9418
3694667.9998
4560577.0958
4798027.8709
1478213.2920
8097036.3137
1985886.1496
6006183.2110
54151.4785
SELECT
DATE_TRUNC('month', orderdate) AS order_month,
SUM(totaldue) AS total_sales
FROM
sales.salesorderheader
GROUP BY
order_month
ORDER BY
order_month
03
Save and share analyses effortlessly, complete with contextual summaries and insights
04
Stay ahead with future developments, including more interfaces, deep-dive analysis, and proactive engagement
Amplify your data stack
Advantages of AI analytics
Text-to-analytics in 60 seconds
Insights are valuable, but few can find them. Get instant insights with Quest-1.
Text-to-analytics in 60 seconds
Insights are valuable, but few can find them. Get instant insights with Quest-1.
Linked to your entire data infrastructure
Quest-1 creates a knowledge graph across your data tools - databases, catalogs, semantic layer, and business intelligence.
Linked to your entire data infrastructure
Quest-1 creates a knowledge graph across your data tools - databases, catalogs, semantic layer, and business intelligence.


Chat, file a ticket, email or text
A natural language interface allows analytics to be accessible wherever you can type.
Chat, file a ticket, email or text
A natural language interface allows analytics to be accessible wherever you can type.

Self-improvement
Explore Quest-1's adaptive abilities of learning from conversation and suggesting new knowledge.
Self-improvement
Explore Quest-1's adaptive abilities of learning from conversation and suggesting new knowledge.
Unlock the full potential of your data
Whether you're a large enterprise or a growing startup, Patterns is your gateway to unlocking the full potential of your data. Empower your team, gain actionable insights, and stay ahead of the competition with Patterns by your side.
Whether you're a large enterprise or a growing startup, Patterns is your gateway to unlocking the full potential of your data. Empower your team, gain actionable insights, and stay ahead of the competition with Patterns by your side.
Whether you're a large enterprise or a growing startup, Patterns is your gateway to unlocking the full potential of your data. Empower your team, gain actionable insights, and stay ahead of the competition with Patterns by your side.
Solutions
For Startups
Make your first analyst an AI for a fraction of the cost of a full-time hire. Patterns will manage your data and model infrastructure saving your engineering team time and money. You just need to ask the right questions.
For Enterprise
Secure your IP and provide safe data access with our scalable enterprise LLM. Get a continiously improving privately trained AI, embedding your unique knowledge for accurate results, trained and deployed in your cloud.
For Agencies
Add AI analytics to your service offering and never build a dashboard again for your customers. White-label Patterns and let our AI do all the hard work to service ad hoc data requests. Scale your impact without scaling your headcount.
For Developers
Leverage our API (beta) to integrate Patterns directly into your app and enable all your customers to self-serve data analytics.
About us